

We’ve added a new feature to the EDLM website—a Visualizations page. It offers users a different way to explore our collection of day diaries. Since our archive is a born-digital collection, it lends itself to data visualizations. As an experiment, we’ve embedded three visualization tools from Voyant Tools a web-based reading and analysis environment for digital texts, here.
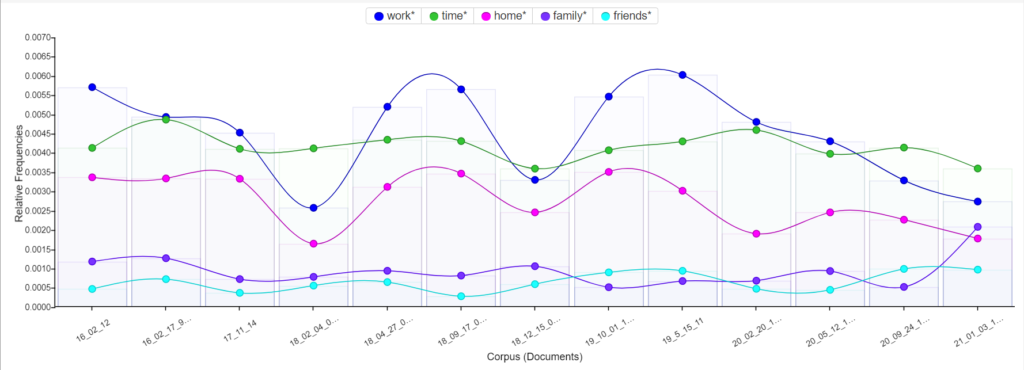
We provide three visualization options, each of which can help a user identify themes and patterns within the text. The first is the TermsBerry tool which visualizes frequently occurring connections between words. Second, we have embedded the Collocates tool, which provides a table view of the same patterns. Finally we included the Trends tool, which shows how frequently particular terms appear over time in our archive. There are options on the bottom of each tool window to adjust the visualization it provides.
These are pretty basic tools and there is much more to be done with our archive in terms of computational and textual analysis. Our hope in introducing these tools is that we give users some sense of what the archive we’ve constructed contains and prompt them to ask new questions about the diaries. When time and resources allow, we plan to add new visualizations that offer a variety of ways to make sense of EDLM’s digital archive. (For a glimpse of what these might look like, visit this site, which allows you to explore the language contained in diaries collected in 2017-2018.)
If anyone is interested in accessing the texts for our diaries to do more visualization or text analysis, drop us a line using the contact form on this site.
****
New Diary Day!
Please note as well that we’ve scheduled the next Diary Day for Friday, October 22. Sharpen your pencils and get ready to add new entries to our archive. If you’re not already signed up as a diarist, please contact us at edlmiddletown@gmail.com to do so.